ELK stack configuration
Introduction
Analyse ARender performances in ELK stack.
ARender returns statistics on its usage, like the loading time of a document and the opened document type. Information is stored in log files. It is possible to analyse these logs with the ELK stack.
You need to use following applications from the ELK stack : Elastisearch and Kibana :
- Elasticsearch : stores and indexes data. It is a NoSQL base allowing to manage big data.
- Kibana : is a Web interface allowing to search and visualize graphical data.
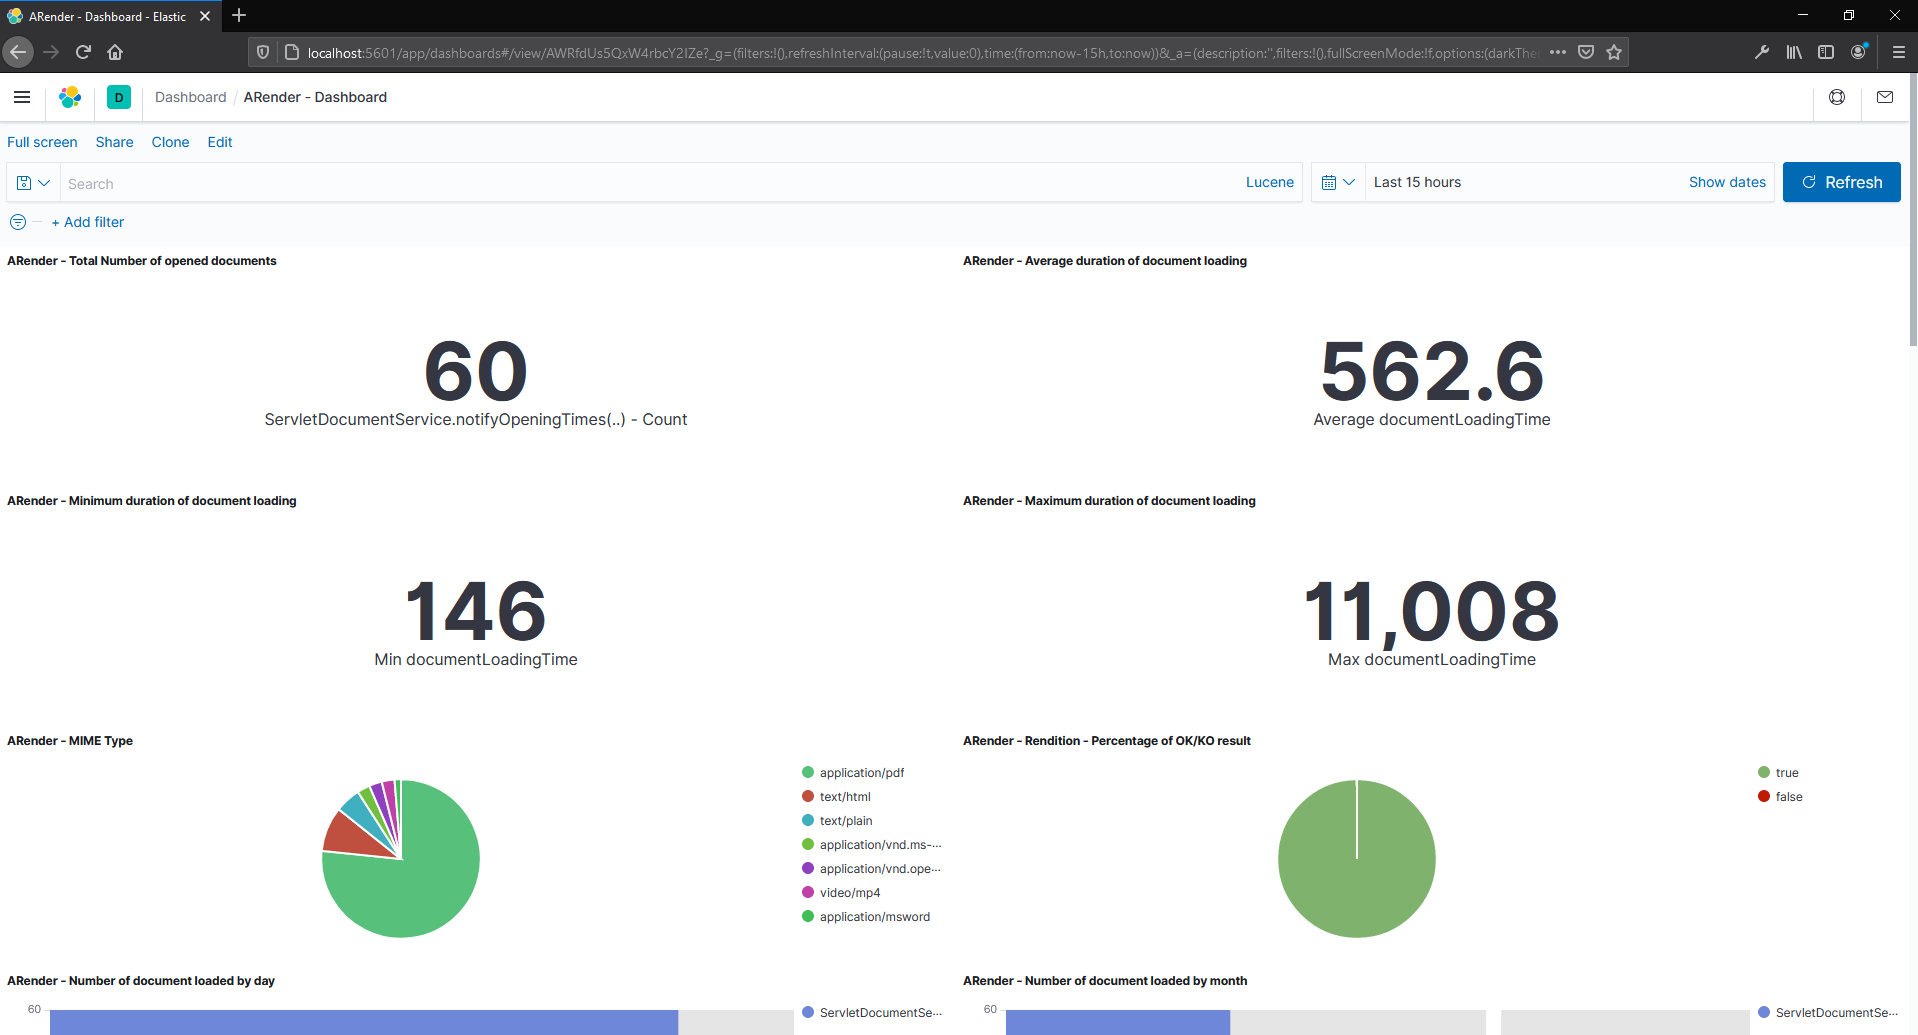
In Kibana data are shown in a graphical user friendly way. Graphics creation is simple and there are lots of customization possible.
See below examples :
-
Average document loading time :

-
MIME Type distribution :

Prerequisites
To import visualizations and dashboards with .ndjson files
- Kibana version 7.2.0 and above
- ElasticSearch version 7.2.0 and above
To import visualizations and dashboards with .json files
- Kibana version 5.x and above
- ElasticSearch version 5.x and above
Elasticsearch
Installation
Follow official documentation to install ElasticSearch : https://www.elastic.co/guide/en/elasticsearch/reference/current/
Start ElasticSearch
Follow official documentation to start ElasticSearch : https://www.elastic.co/guide/en/elasticsearch/reference/current/starting-elasticsearch.html
Kibana
Installation
Follow official documentation to install Kibana : https://www.elastic.co/guide/en/kibana/current/install.html
Start Kibana
Follow official documentation to start Kibana : https://www.elastic.co/guide/en/kibana/current/start-stop.html
Kibana configuration prerequisites
Before configuring Kibana, you need to open at least one document in ARender in order to have indexes created in Elasticsearch.
Kibana configuration
Creation of index pattern
-
Open Kibana in your browser. Local URL : http://localhost:5601/app/kibana
-
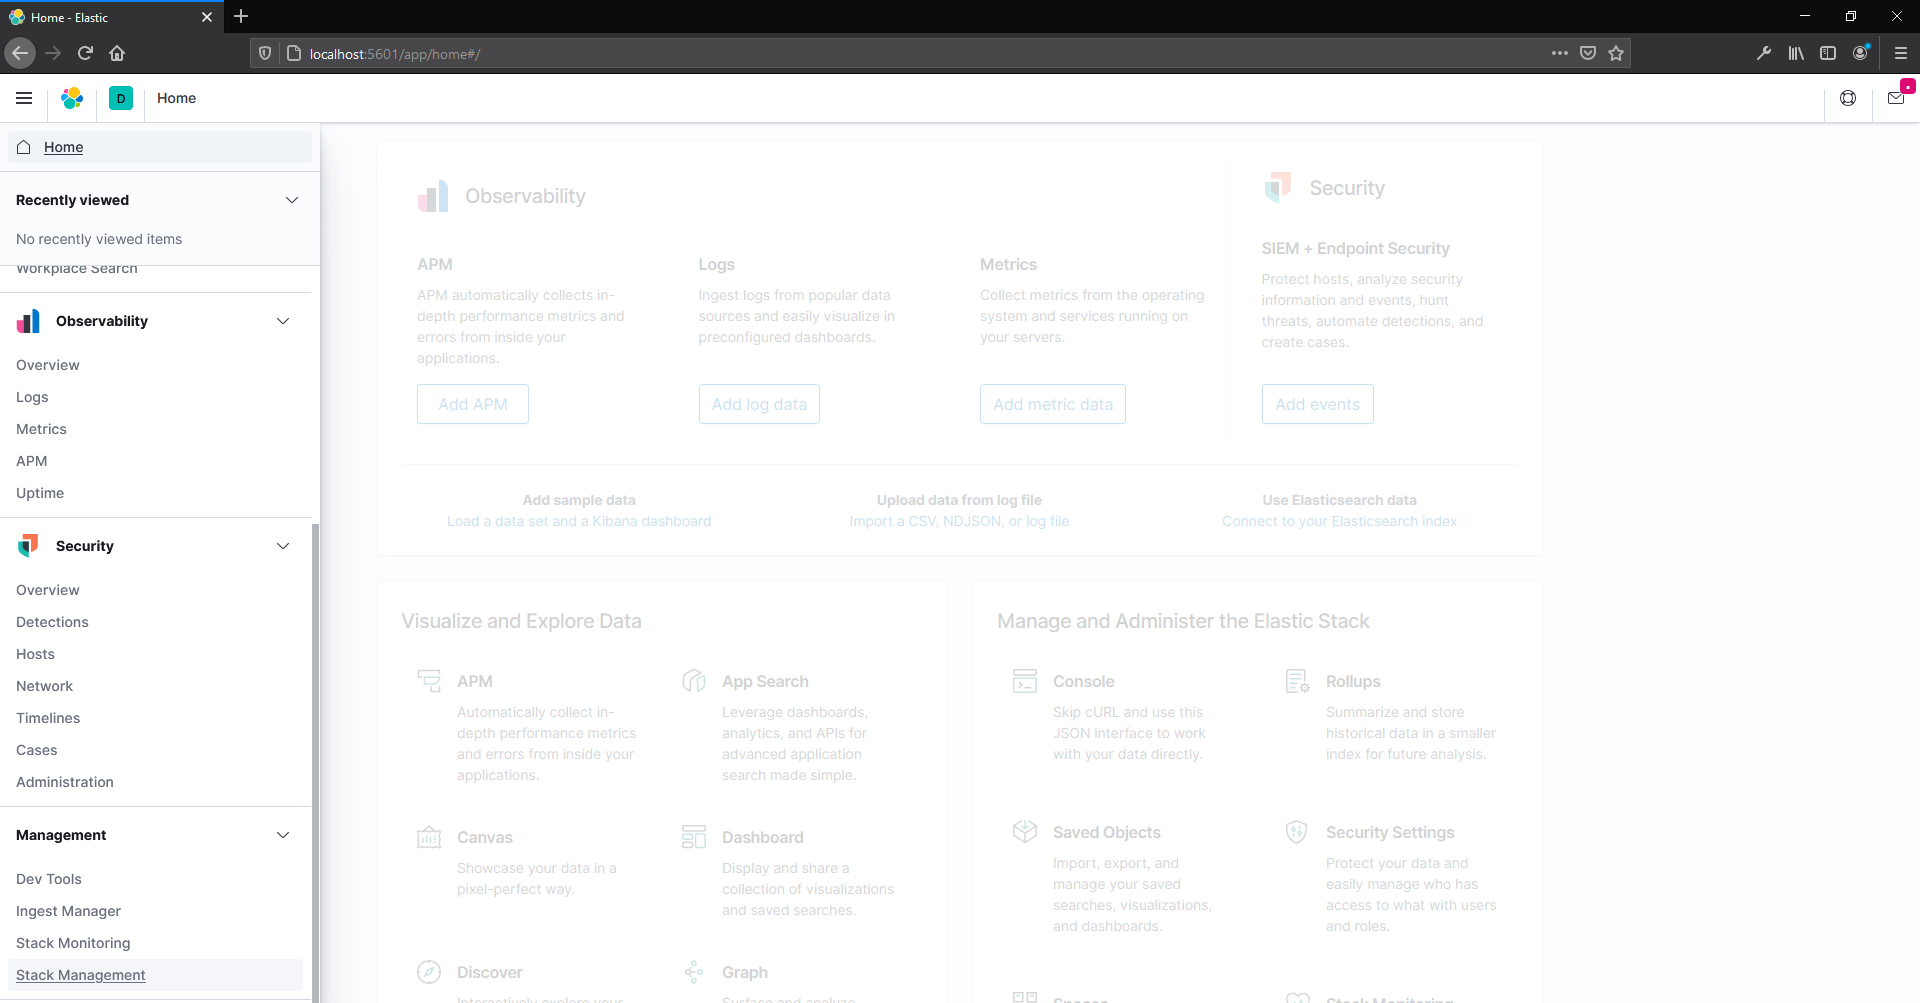
Go to the Management section :
-
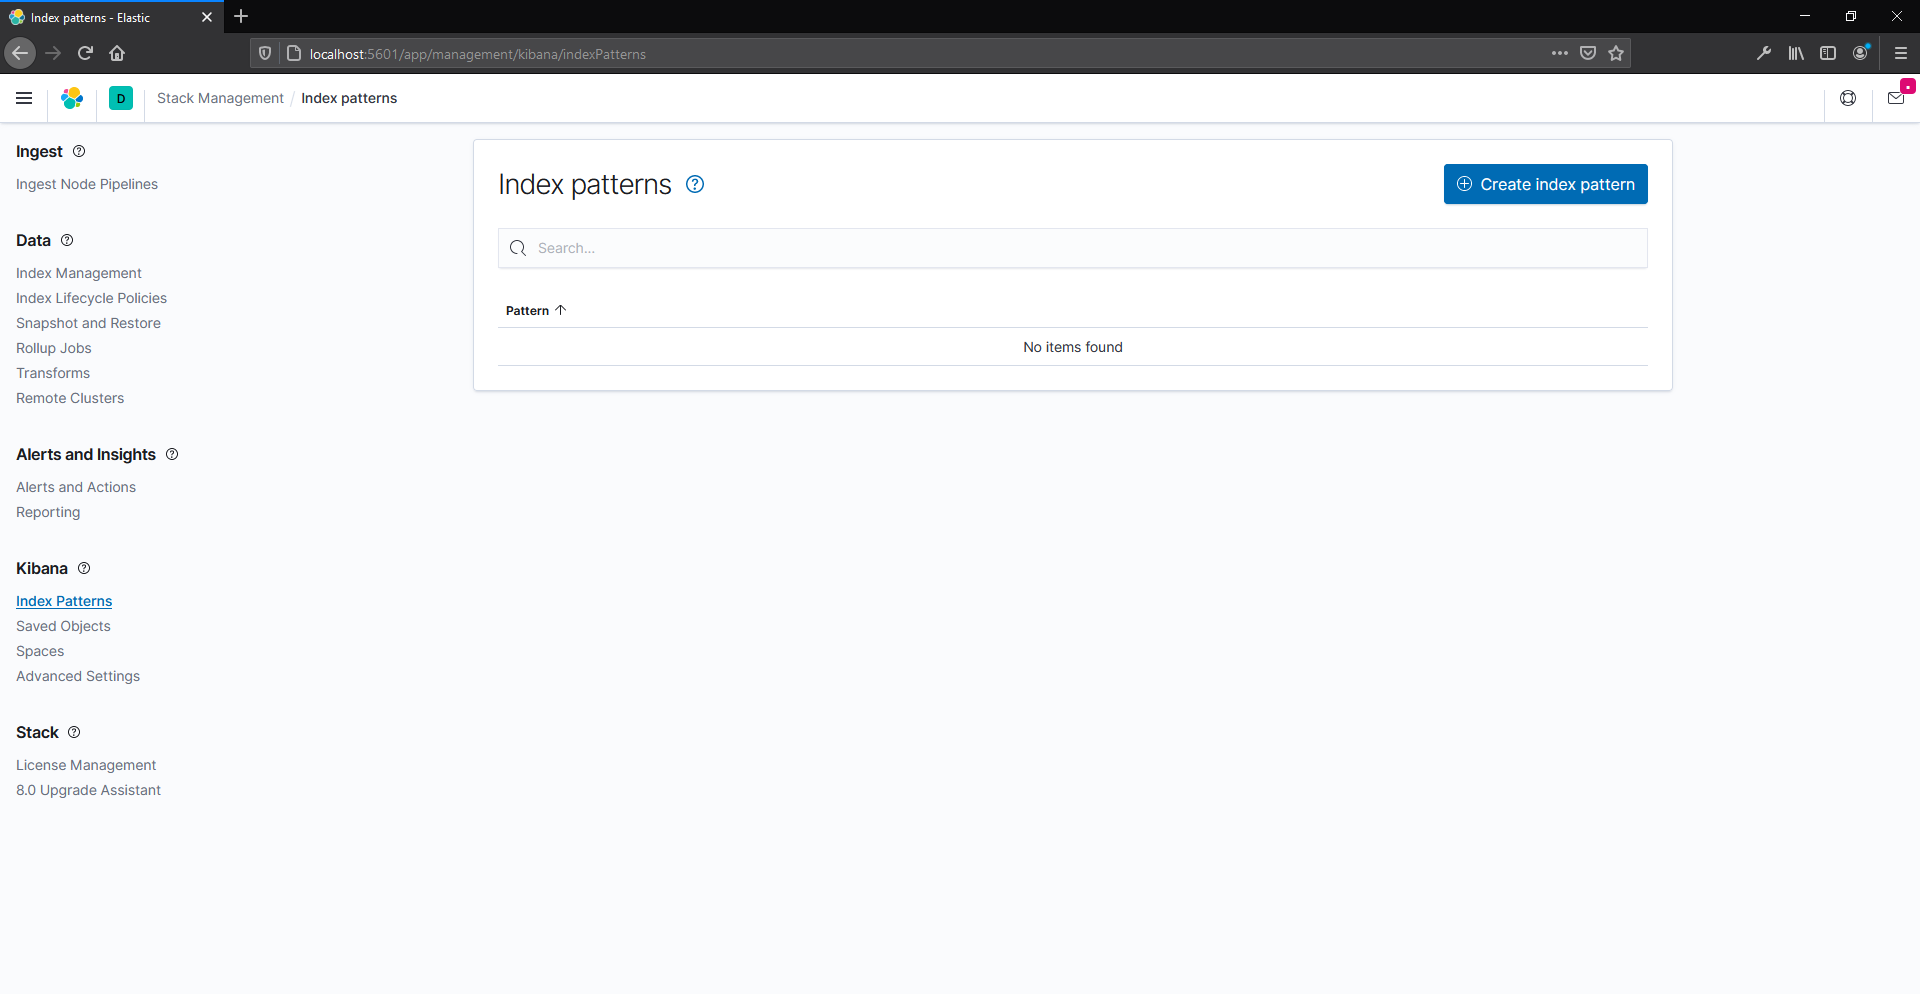
Go to the Index Patterns :
-
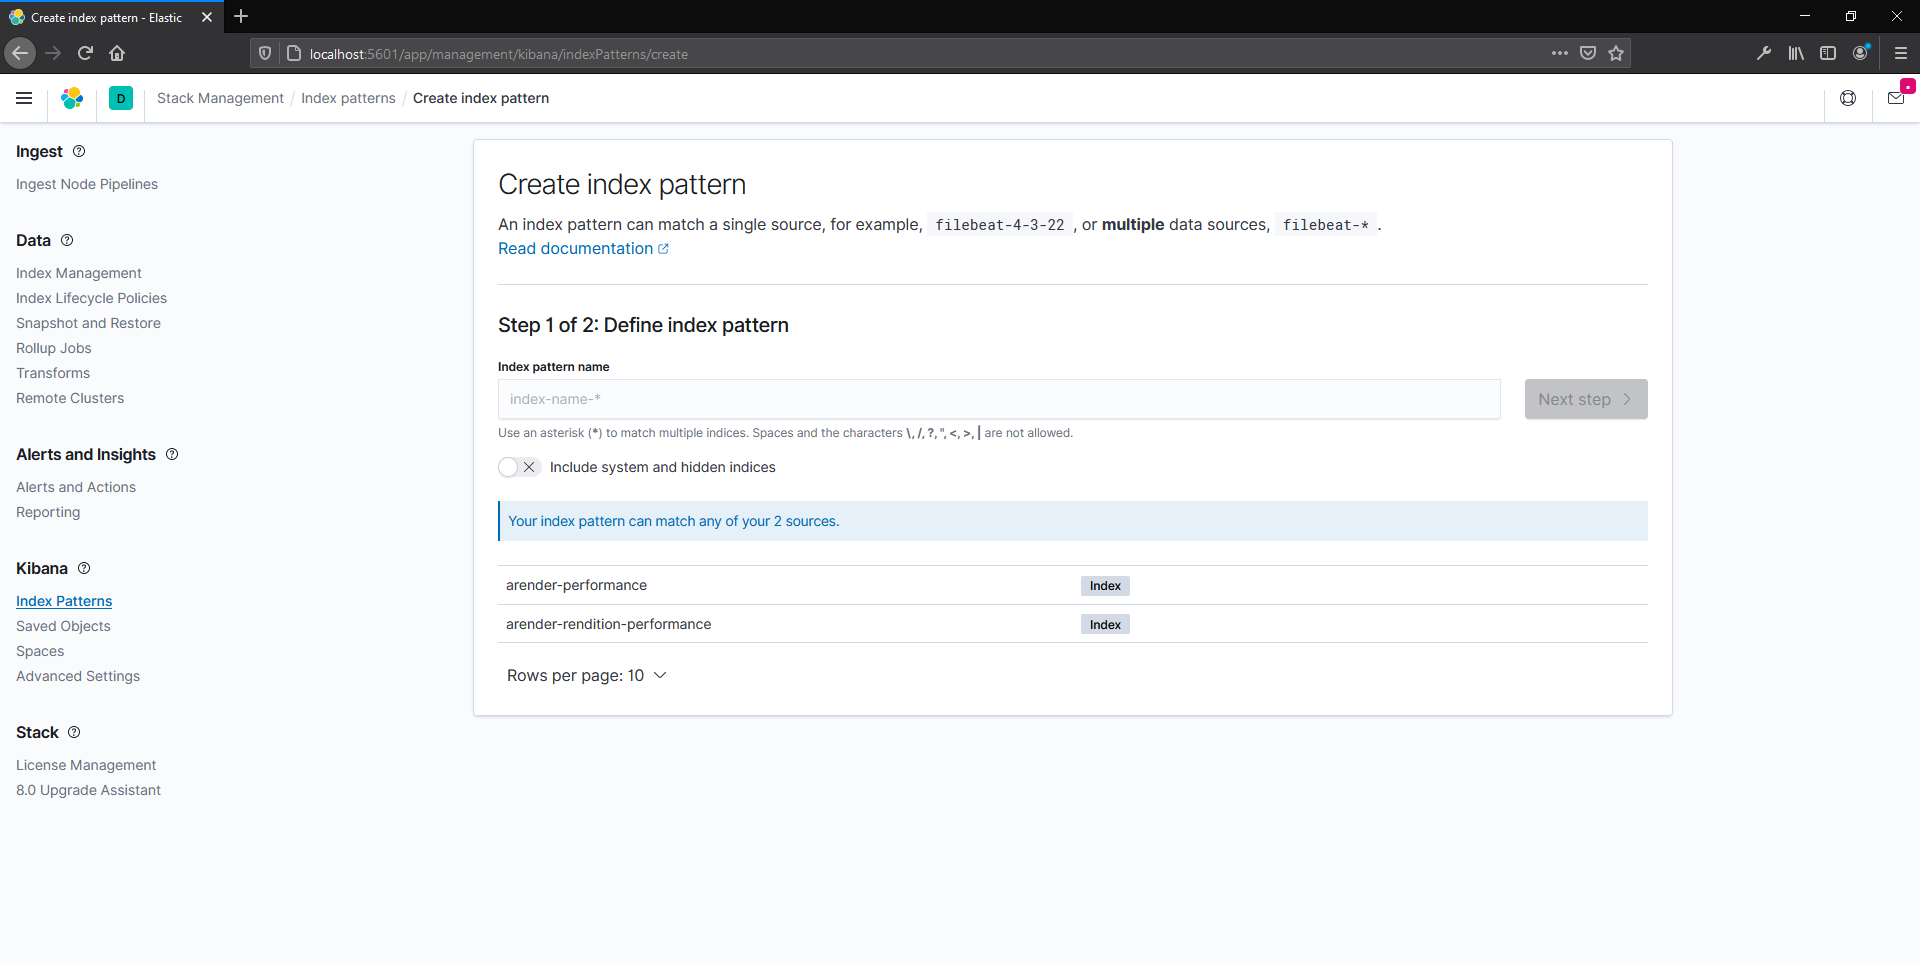
Add the 2 indexes :
- arender-performance
- arender-rendition-performance
- arender-performance
Import dashboard example
-
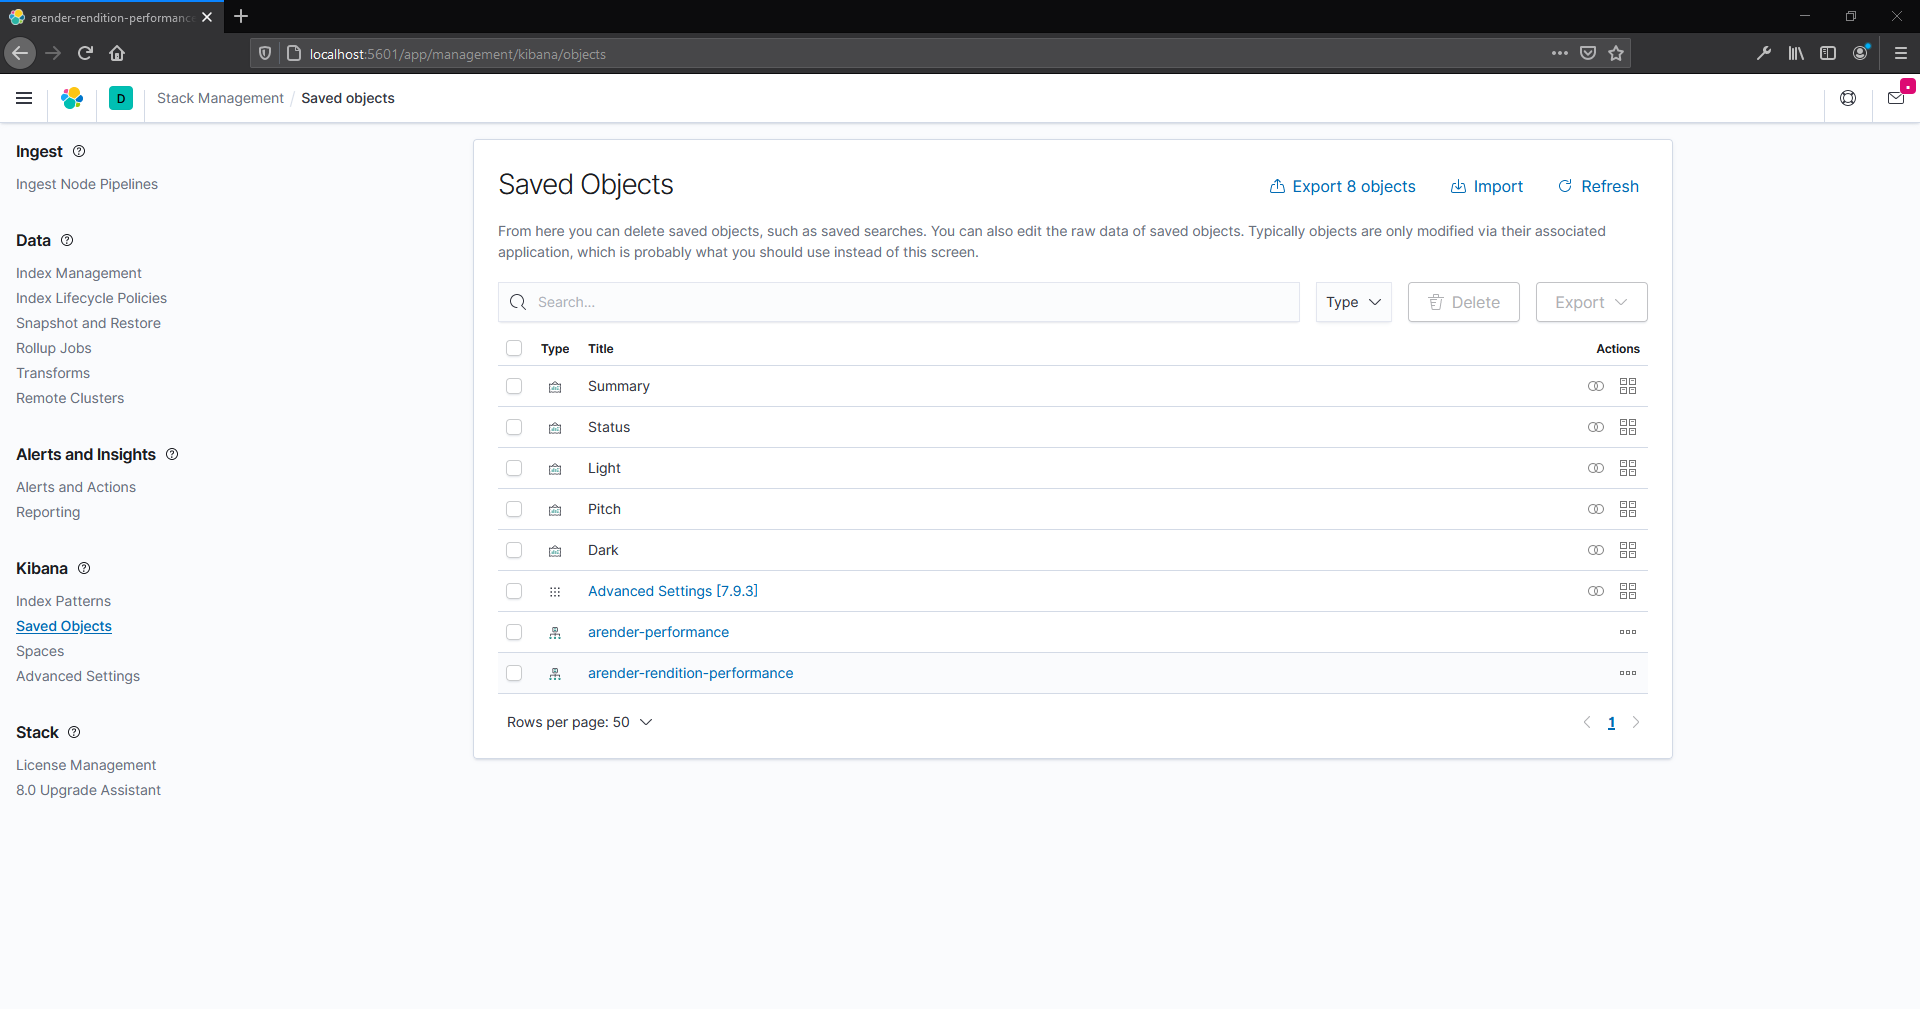
Go to Saved Objects :
-
For version allowing .ndjson file import (Since Kibana 7.2.0):
- First import visualization. Click on import and select the file : Arender-visualizations.ndjson
- Then import dashboard. Click on import and select the file : Arender-dashboard-example.ndjson
-
For version only allowing .json file import :
- First import visualization. Click on import and select the file : Arender-visualizations.json
- Then import dashboard. Click on import and select the file : Arender-dashboard-example.json
-
Open dashboard :
